Overview
Timeline charts are User Items that create a chart where a series of events are arranged on a bar graph. Each event can be a single point in time or a date range. See the example chart.
For people in the chart who have a person page entry, the chart entry links to the person page entry and vice-versa.
Some chart colors are determined by the Theme but can be changed by the user via the properties in the Stylesheets.Theme.Chart section. Other stylesheet options are controlled via the chart-related styles in the Stylesheet.System section.
Edit Timeline Chart
The Edit Timeline Chart window controls the properties of a Timeline Chart.
Shared Properties
The Title, Description, Name Options, Box Lifespan Option, Box Lifespan Format, and Box Date Format properties are explained on the Chart Properties page.
Timeline Entries
The contents of a Timeline Chart are defined in groups of events. Each group is considered a Timeline Entry. Each group is assigned a title, a color, and other properties that vary by the timeline entry type. See the Edit Timeline Entry Window.
Start Year and End Year
Second Site will automatically determine the start year and end year for the chart using the dates of the timeline events. Events that are read from Timeline Files are ignored for the purposes of defining the overall date range for the chart, but you may wish to show events that occurred before or after the calculated range. If so, you can specify a Start Year and/or End Year manually. Otherwise, leave both text boxes empty.
Truncate At
The Truncate At textbox can be used to set the number of characters beyond which Second Site will truncate the event text. Second Site adds an ellipsis (...) to the end of the text to indicate that more text is present. When text is truncated, the full text can be seen by moving the mouse over the text. The resulting tooltip stays visible until the mouse goes over the tooltip and then out of the tooltip. You may want to set the Truncate At value if you add events with long text.
Pad Pixels
The Pad Pixels textbox controls how many pixels of white space are added to the right hand side of the chart. The default is 0; the chart is only as wide as the timeline scale end year requires. For charts with long text underneath moderate to short duration events at the end of the timeline timespan, the text for those events may wrap onto multiple text lines. That wrapping usually interferes with the proper layout of the chart. Use the Pad Pixels value to add space so that the text lines won't wrap.
Pad Years
The Pad Years textbox controls how many years of white space are added to the right hand side of the chart. The default is 0; the chart is only as wide as the timeline scale end year requires. For charts with long text underneath moderate to short duration events at the end of the timeline timespan, the text for those events may wrap onto multiple text lines. That wrapping usually interferes with the proper layout of the chart. Use the Pad Years value to add space so that the text lines won't wrap. The Pad Years value is rounded up to the next multiple of 10.
The Pad Years value extends the timeline scale and is measured in years, whereas the Pad Pixels value extends the white space beyond the end of the timeline scale and is measured in pixels. A year is 6 pixels wide.
Note Some charts will not be formatted properly without adjusting one or more of the Truncate At, Pad Pixels, and Pad Years properties.
Edit Timeline Entry
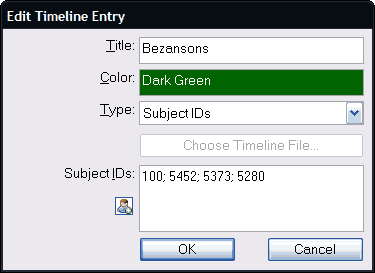
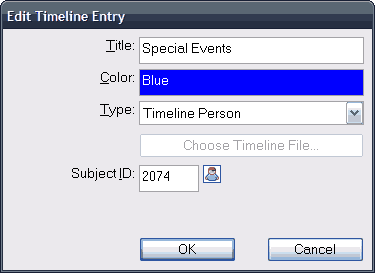
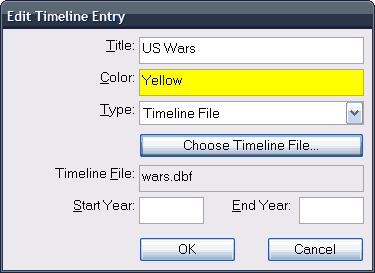
Each Timeline Entry defines a group of events. Each group has a Title, a Color, and a Type.
Name
The Name property is required. It determines the name of the Timeline Entry in the list in the Edit Timeline Chart window.
Color
The Color property defines the color of the bar that accompanies the events included by the Timeline Entry. You can key color codes (#FF0000 for red, etc.), or you can key color names (red, blue, etc.) See the Color Box page for a list of color names and color codes.
The Name and the Color are included in the legend at the bottom of the chart.
Type
There are three choices for the Type property: Subject IDs, Timeline File, and Timeline Person. The controls visible in the window vary according to the chosen Type.
Type=Subject IDs

When Type=Subject IDs, you enter one or more TMG IDs into the Subject IDs textbox. Separate TMG ID numbers with semicolons: 1; 2; 3. The lifespan of each person will be added to the chart.
Note Adding a person to a Timeline Chart, but not showing their lifespan dates, is nonsensical. Therefore, Second Site ignores the exclusion status of the people added to Timeline Charts. If you do not want to show a person's birth and/or death date, do not include them in a Timeline Chart.
Type=Timeline Person

When Type=Timeline Person, you enter a single TMG ID in the Subject ID textbox. Second Site adds that person's events to the chart.
Note The Timeline Person type was not intended to show events from any person in your database. The feature is provided primarily so that you can implement custom timelines within TMG using a non-person. You may find that using a real person meets your objectives, but some events will not display properly.
A Timeline Person is a person you add in TMG that does not represent an actual person. The Timeline Person's record is a convenient place to create events that represent significant events in your family history. The event sentences and memos, etc., can be constructed such that they work well on the timeline chart. If you use a "from x to y" date in the date field of the event, Second Site will create a bar entry on the chart. Otherwise, it will create a short-duration event with a marker rather than bar.
Type=Timeline File

When Type=Timeline File, you use the [Choose Timeline File...] button to select a timeline file. Second Site supports the timeline files provided with TMG. Events in the timeline file are added to the chart. If you specify a Start Year and/or End Year, only events that fall between the specified range will be added to the chart. Second Site always restricts timeline events to those events that fall within the overall range defined for the Timeline Chart. The Start Year and/or End Year properties can be used to further restrict events read from the timeline file.
TMG timeline files are database tables, and some of those tables are in DBase format. Second Site can not read DBase tables, so for those timeline tables it uses a timeline converter application to convert the DBase table to to a Visual FoxPro table. The timeline converter application only supports TMG v7 timeline files.
This page last changed on 02 May 2018.